Analysis
Interpreting Player Heatmaps: Football’s Hidden Tactical Story
Heatmaps can mislead if you read them wrong. Here's a simple step-by-step guide to interpreting player heatmaps and spotting what the colors really mean.

Heatmaps can lie as much as they reveal, and red doesn’t automatically mean hard work or smart play.
At face value a heatmap is just a color map showing where a player touched the ball or spent time, so meaning comes from context.
This post gives a simple step-by-step way to interpret player heatmaps: confirm pitch orientation and the legend, check the time window and hotspots, assess spread versus role, and always validate with event stats and video.
Do that and the pixels stop being pretty pictures and start telling football’s hidden tactical story.
How to Read a Football Player Heatmap Step by Step
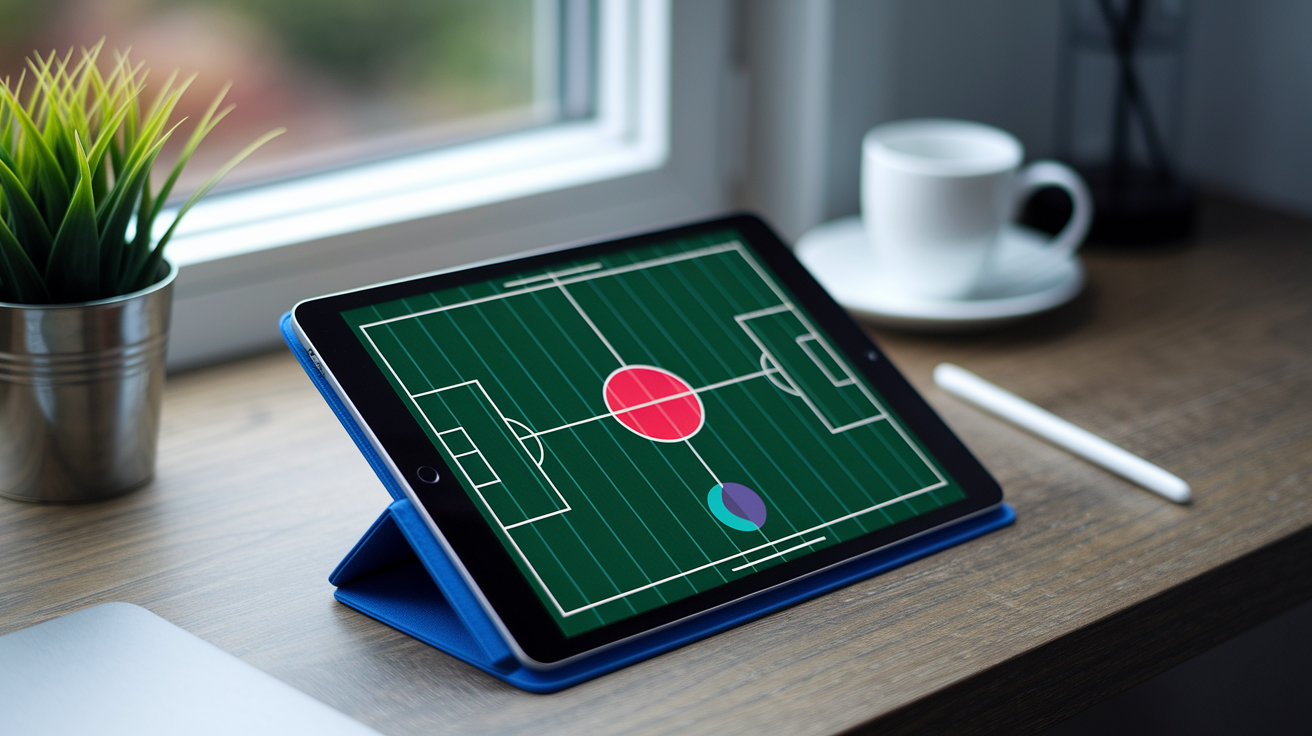
A heatmap isn’t a grade. It’s a spatial density display, basically a visual record of where a player touched the ball, took action, or just stood for ninety minutes. Before you decide whether that pattern’s good or bad, you need a method. Here’s one that works whether you’re watching a Saturday league game or breaking down a Champions League tie.
- Confirm the pitch orientation and which direction the team attacks.
- Read the legend and figure out whether colors represent touches, time, actions, or normalized intensity.
- Check the period covered, like 90 minutes, one 45 minute half, or a 15 minute window.
- Locate the hottest zones. Use at least 10 touches per cell or 70/100 intensity as an initial hotspot reference.
- Assess concentration, spread, width, depth, symmetry, and empty areas.
- Compare the pattern with the player’s position and assigned tactical role.
- Validate the read with event statistics, match context, and video.
That order matters. Skip step one and you might read a defensive third as an attacking one. Skip step seven and a smart read turns into a confident guess.
Here’s the part people get wrong most: red means “more activity relative to the selected scale.” That’s it. It doesn’t mean good play, and it doesn’t automatically mean high work rate. A fullback showing a deep red strip along the touchline could be doing exactly what the coach asked, staying in a defined lane and overlapping on schedule.
Now picture that same red strip belonging to a central pivot, a midfielder whose job is anchoring the middle of the pitch. Suddenly the same color pattern tells a completely different story. Maybe it’s tactical drift. Maybe it’s a specific instruction to cover a teammate’s gap. Maybe it’s a response to the opponent’s press. The pixels look identical. The meaning doesn’t.
How Football Heatmap Data and Visual Scales Are Constructed
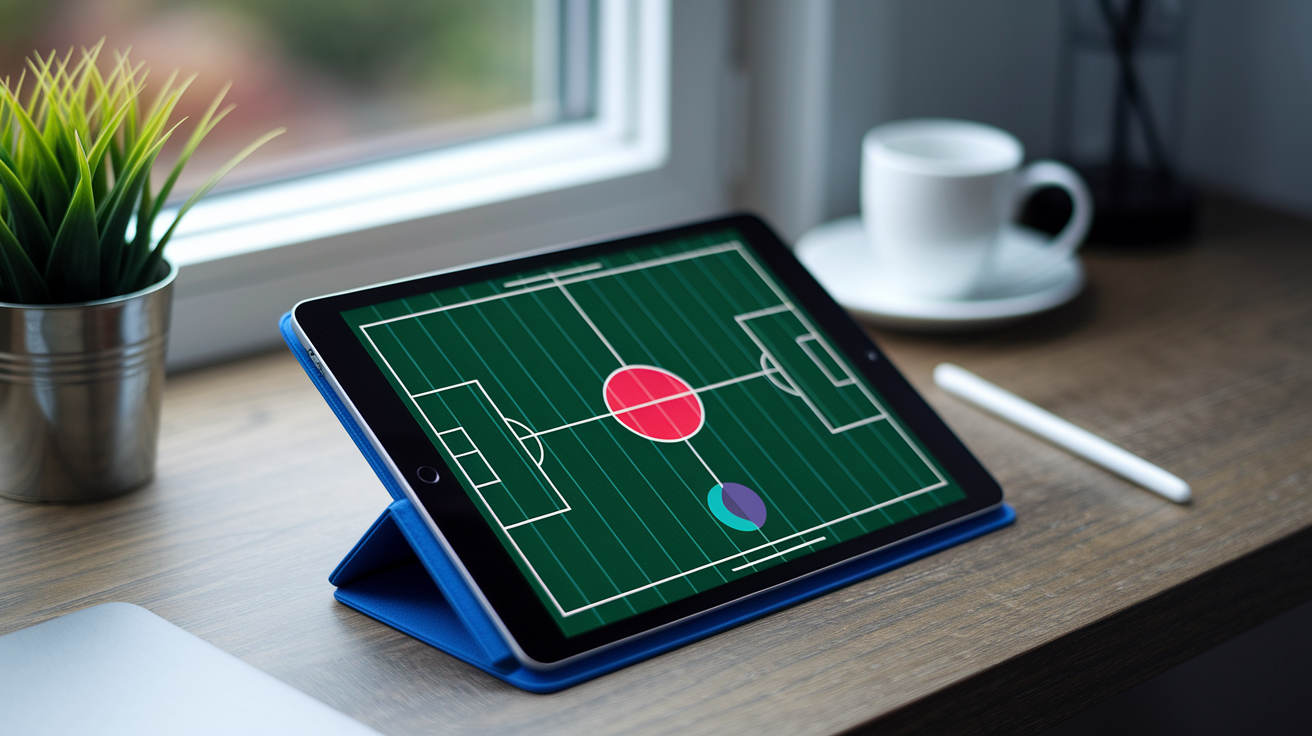
Heatmaps don’t start as pictures. They start as numbers, and those numbers come from two different places.
Event feeds record discrete actions. A touch here, a pass there, a shot in the 73rd minute. Each entry has a location attached. Tracking data works differently. GPS and optical camera systems log a player’s x,y position over and over, often 10 to 25 times per second, creating a near-continuous trail of movement rather than isolated dots. Event data tells you what happened. Tracking data tells you where someone was, constantly, whether they touched the ball or not.
Once you’ve got location data, it needs grouping into spatial bins across the pitch, usually mapped as 105 by 68 meters. A coarse grid, something like 12 by 8 cells, smooths everything into broad zones useful for team shape. A finer grid, 24 by 16, 21 by 14, or cells around 5 by 5 meters, keeps a lot more local detail, showing exactly which patch of grass a winger favored. Bigger cells hide nuance. Smaller cells can look noisy if there isn’t enough data to fill them meaningfully.
That’s where smoothing comes in. Gaussian or kernel density methods spread each recorded point across a bandwidth, often somewhere between 3 and 10 meters. A wider bandwidth blends nearby clusters into one soft shape. A narrower one keeps sharper edges and can reveal two separate hotspots that a wider setting would’ve merged into one.
And then there’s the scale itself. Some heatmaps display raw counts. Others convert to 0 to 1 probabilities, 0 to 100 normalized intensity, or percentile rankings compared across a dataset. The same underlying touches can produce a completely different looking map depending on which of these choices gets made.
Position Specific Benchmarks in Football Player Heatmaps
(((alt-img3)))
Before comparing any player’s map to a benchmark, match that benchmark to the position, the formation, and the specific role the player was asked to fill. A wingback in a back three behaves differently from a fullback in a back four, even if commentary calls both “fullback.”
Goalkeeper and Defender Benchmarks
Goalkeepers typically show a tight, concentrated hotspot inside the 16.5 meter penalty area. Expected, and honestly kind of boring to look at, until you see a sweeper keeper’s map instead. Those extend 20 to 25 meters from goal, with activity spilling well outside the box as the keeper acts almost like an extra defender.
Center backs cluster in the defensive third, and their maps often show lateral separation during build up play. One drifts left, one stays central or shifts right, depending on how the team wants to split passing angles.
Fullbacks carry the widest range of baseline shapes. A conventional fullback shows a wide vertical band hugging the touchline. An inverted fullback shows central or half space occupation instead, tucking infield rather than overlapping outside. As reference points rather than hard targets, 10 to 25 final third touches and 12 to 25 sprints per 90 give a reasonable sense of what an actively involved fullback’s output might look like.
Midfielder Benchmarks
Midfield benchmarks split along role lines more than any other position group. A deep pivot concentrates in a tight, central zone just in front of the defense. A double pivot splits that job between two players side by side. A box to box midfielder stretches that corridor much further, touching both defensive and attacking thirds across 90 minutes.
Central midfielders overall often land somewhere between 40 and 90 touches per 90, though that range swings heavily based on possession share and role. Number 10s show a different signature entirely, concentrated roughly 18 to 25 meters from goal, operating in the gap between a midfield line and a striker.
Winger and Striker Benchmarks
Touchline wingers show heat hugging the sideline in the final third. Inverted wingers shift that same zone inward, cutting into the half space or central channel instead. As a loose reference, 2 to 6 progressive carries per 90 gives a sense of a winger’s ball carrying involvement.
Strikers split into two broad categories. A traditional number 9 concentrates almost entirely inside the penalty area, while a
Final Words
Right in the action: you learned a quick definition, a seven-step read-it-now checklist, how maps are built, position benchmarks, team-shape signals, time-sliced comparisons, worked examples, companion metrics, practical uses, and one tight quality-control list.
Keep the hotspot rules (10 touches or 70/100), check grid, smoothing, and minutes, and always validate with event counts and video.
With those tools, interpreting player heatmaps in football stops being guesswork and becomes a reliable part of your match toolkit — you’ll spot meaningful patterns faster.
FAQ
Q: How do I interpret a heatmap? What does a heatmap mean in football? What do heatmaps tell you?
A: A heatmap in football is a spatial density display of touches or tracked locations, with colors from blue/green to red showing low-to-high activity; hotspots need context like minutes, role, and normalization.
Q: How to check player heat map?
A: To check a player heat map, confirm pitch orientation, read the legend, note the time window, find hotspots (≥10 touches or >70/100), compare to the player’s role, and validate with event stats and video.
More from Politics
 Events
Most Memorable Underdog Upsets in Olympic History
 Analysis
Set-Piece Mastery: Decoding Corners and Free-Kicks Tactically
 Analysis
Statistical Metrics That Truly Define Midfield Mastery
 Analysis