Analysis
Statistical Metrics That Truly Define Midfield Mastery
Goals and assists don't tell the full story. Here's the real checklist of statistical metrics to evaluate football midfielders, from passing to pressing.

Think goals and assists tell you who controls a game? That’s a half-truth.
True midfield mastery is more like a conductor: the best players set tempo, move the ball forward, create chances, and win the dirty battles, and that shows up across several stats, not one.
This guide walks through the statistical metrics that actually matter: passing, progression, creation, defending and pressing, and how to compare them fairly by minutes, role, and team possession.
If you want a reliable midfield evaluation, use the combined checklist, not a single headline number.
The Most Useful Numbers for Judging Midfielder Performance
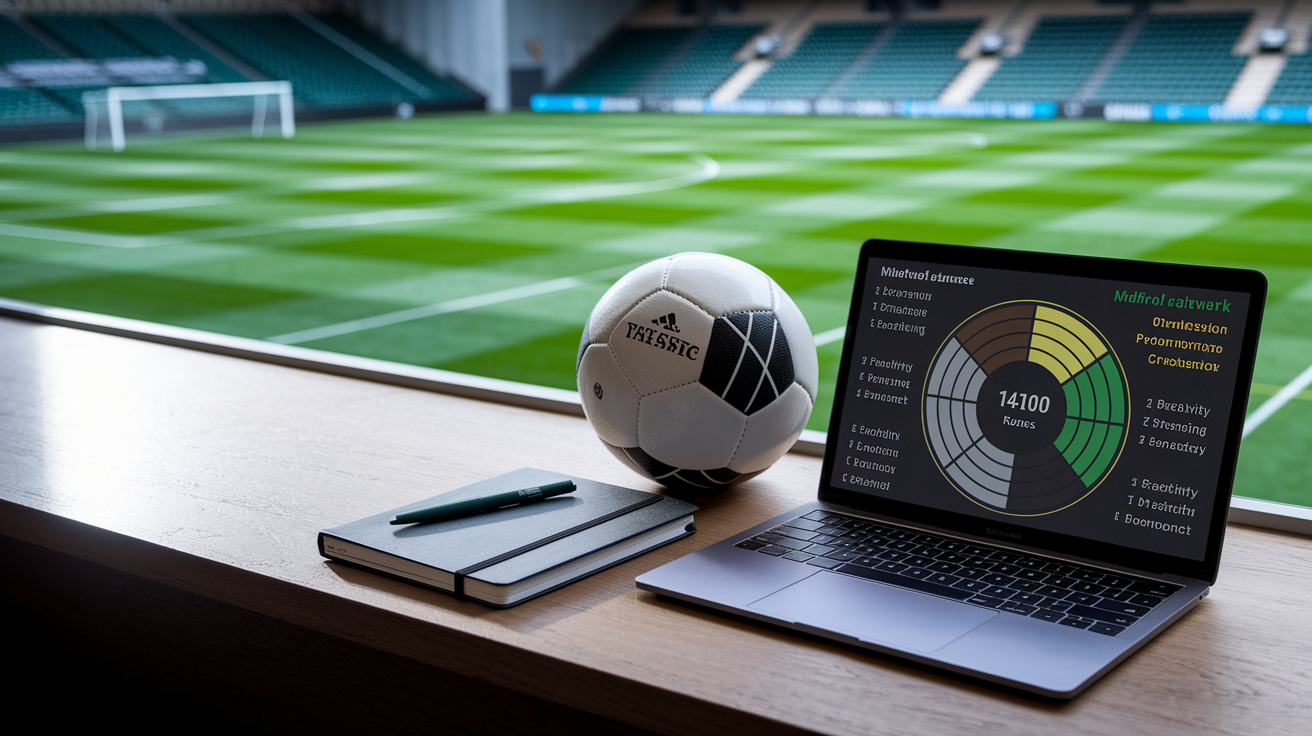
No single statistic defines a midfielder. Not goals, not assists, not even a flashy pass completion rate on its own. The players who actually control games tend to show up well across several categories at once. So the strongest evaluation combines passing, progression, creativity, defending, pressing, carrying, and physical output into one picture rather than leaning on a single number.
The essential measures fall into natural groups. Passing tells you how safely and how dangerously a player moves the ball. Progression tells you whether that movement actually advances the team. Creation shows chance making. Defending and pressing show ball winning work. And the right mix depends heavily on the job, a defensive No. 6, a box to box No. 8, and an attacking No. 10 should never be judged by the same checklist.
| Metric | Plain-Language Outcome | Primary Category | Detailed Analysis |
|---|---|---|---|
| Pass completion % | How often a pass finds a teammate | Passing | See passing security section |
| Progressive passes per 90 | How often passing advances the team | Progression | See ball progression section |
| Passes into final third | Supply into dangerous attacking zones | Progression | See ball progression section |
| Key passes per 90 | Direct chances set up for teammates | Creation | See chance creation section |
| Expected assists (xA) | Quality of chances created, regardless of finishing | Creation | See chance creation section |
| Progressive carries per 90 | Ball advanced by running rather than passing | Progression | See ball progression section |
| Tackles won per 90 | Success rate in direct ball challenges | Defending | See defensive metrics section |
| Interceptions per 90 | Reading and cutting out opponent passes | Defending | See defensive metrics section |
| Ball recoveries per 90 | Regaining loose or contested possession | Defending | See defensive metrics section |
| Pressures per 90 | Volume of defensive pressure applied | Pressing | See defensive metrics section |
The sections below walk through how to compare these measures fairly, normalize them for minutes and opportunity, and read them properly within each midfielder’s tactical role.
How Midfielder Statistics Become Fair and Comparable
(((alt-img2)))
Before comparing any two midfielders, the sample size question has to come first. A player with 2,800 minutes and a player with 400 minutes can post wildly different rates purely by chance. So reliable comparisons should generally use 900 to 1,200 minutes, roughly 10 to 13 full matches, before anyone draws conclusions. Below that threshold, a hot streak or a rough patch can swing the numbers hard. One option for handling smaller samples is Bayesian shrinkage, a method that pulls extreme low-minute results back toward the positional average. It’s especially useful for neutralizing a fluke, like a player who looks elite after one explosive 45 minute cameo off the bench.
Once the sample is solid, the next question is which rate to use. Per 90 numbers control for playing time, so a midfielder who plays 60 minutes isn’t unfairly stacked up against one who plays a full match. Per touch and per 100 pass rates go a step further and measure efficiency relative to actual involvement, which matters for a deep lying passer who touches the ball constantly versus a wide creator who gets fewer touches but higher value ones. Possession adjusted metrics solve a different problem entirely. A defensive midfielder on a low possession team will naturally rack up more tackles and interceptions simply because their team defends more often. So possession adjustment corrects that opportunity bias before comparing someone on a dominant team against someone on a counter attacking one.
Percentile benchmarking is where all these rates start to mean something. An 80th percentile result means a player exceeds 80 percent of the players in the comparison sample, but that sample has to be built carefully. Comparing an advanced playmaker’s numbers against all midfielders, including anchors and destroyers, muddies the picture. The comparison group needs to match position, tactical role, league level, and season, otherwise percentiles just measure noise.
Context still has the final say. Opponent strength, team formation, match state, scoreline, fatigue, and injury recovery all shape what a midfielder is asked to do and how much opportunity they get to do it. A deep lying passer chasing a game while trailing 2-0 will attempt different passes than one controlling a 1-0 lead. League quality matters too, since a dominant stat line in a weaker league doesn’t automatically translate upward.
- Apply a minimum sample of 900 to 1,200 minutes.
- Convert volume statistics to per 90 rates.
- Calculate efficiency per touch or per 100 passes where involvement differs.
- Adjust defensive statistics for team possession.
- Build percentiles from a relevant positional, role, league, and season sample.
Final Words
in the action, we laid out the core measures, passing, progression, creation, defending, pressing, carrying, and physical coverage, and showed how a No. 6, No. 8 and No. 10 need different blends.
We set a comparability framework — per-90, per-touch, percentiles, minimum minutes — and gave a practical scorecard to move from raw numbers to video-backed decisions.
Use these statistical metrics to evaluate football midfielders with clearer questions and more confidence. Keep testing the framework and enjoy the process.
FAQ
Q: Do midfielders score goals?
A: Midfielders do score goals; frequency depends on role—attacking No.10s and box-to-box players score more while defensive No.6s score rarely. Judge goals alongside progression, key passes, xA, and defensive work.
Q: What is the best website to compare football players?
A: The best website to compare football players depends on your needs: FBref or StatsBomb for advanced metrics, WhoScored for match stats, and Transfermarkt for market value and appearances—pick by coverage and transparency.
Q: What are 10 common terms used in football terminology?
A: Ten common football terms are: assist, key pass, progressive pass, interception, tackle, press, turnover, xG (expected goals), recovery, and dribble.
Q: How do you read soccer stats?
A: You read soccer stats by converting to per-90 or per-touch rates, checking percentiles against similar roles, adjusting for possession and sample size, and confirming findings with video or tracking context.
More from Politics
 Events
Most Memorable Underdog Upsets in Olympic History
 Analysis
Set-Piece Mastery: Decoding Corners and Free-Kicks Tactically
Analysis
Statistical Metrics That Truly Define Midfield Mastery
 Analysis