Analysis
Statistical Metrics That Truly Reveal Elite Defenders
Tackles don't tell the whole story. Here's a 6-part scorecard with real statistical metrics to evaluate defenders beyond the obvious stuff.

Thinking tackles prove a defender is elite is like judging a striker only by how fast he runs.
Tackles, clean sheets and composite ratings tell part of the story but miss what never became a shot, the pressures that force errors, or how calm a player is on the ball.
This piece lays out a balanced scorecard of six buckets: volume, efficiency, prevention, tactical activity, chance quality and possession contribution, and shows how they together reveal true defensive quality.
Read on for clear rules to compare defenders, spot hidden value, and avoid exposure bias.
A Balanced Defender KPI Scorecard
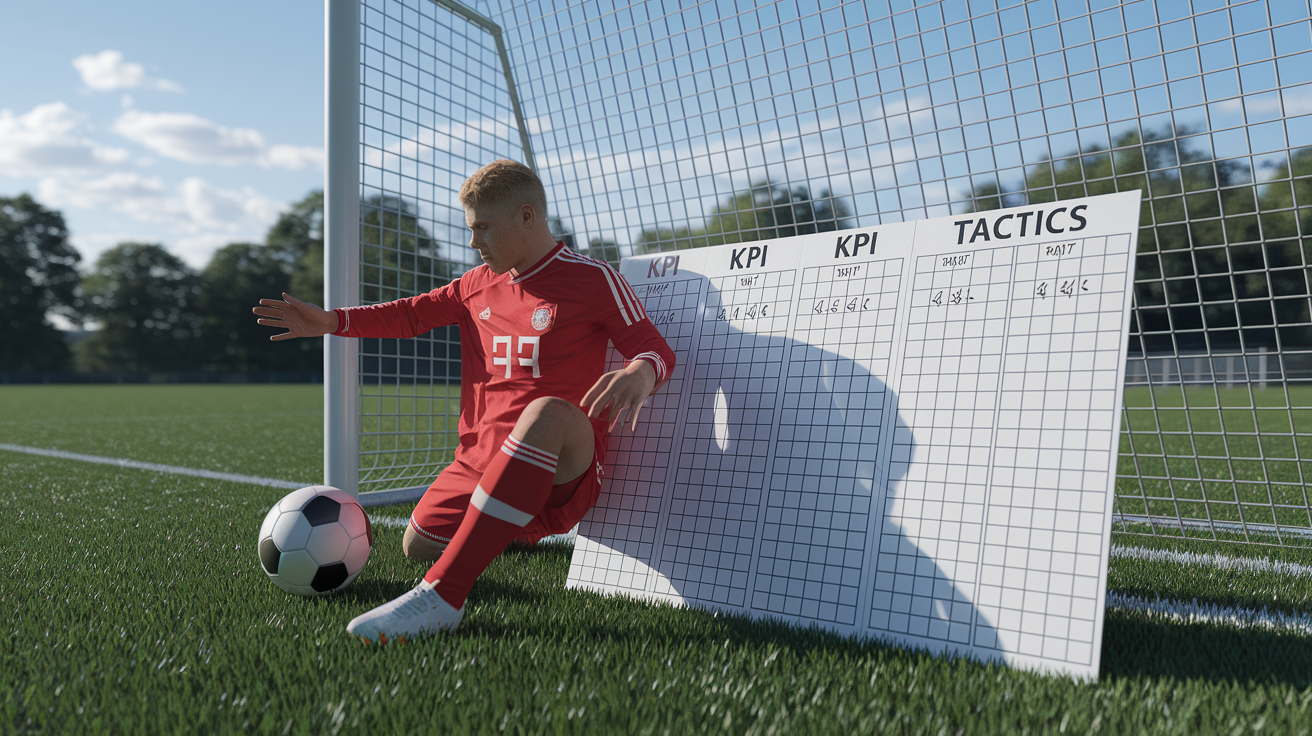
Judging a defender by tackles alone is a bit like judging a striker by how fast they run. It tells you something, sure, but it misses most of the story. Clean sheets get credited to a back four when really the goalkeeper bailed them out twice, or a composite rating gets thrown around without anyone explaining what actually went into it.
A proper defender scorecard pulls from several different buckets. Volume tells you how often someone’s involved. Efficiency tells you how well they come out of those involvements. Prevention looks at what never even got the chance to become a shot. Tactical activity shows pressing habits. Chance quality measures the danger level of what gets through. And possession contribution covers what a defender does once their team actually has the ball. None of these alone gives you the full picture. That’s exactly why they need to sit side by side.
| Category | Representative KPIs | Interpretation Rule |
|---|---|---|
| Defensive volume | Tackles, interceptions, clearances, blocks per 90 | Higher counts suggest more involvement, not automatically better defending |
| Efficiency | Tackle success, ground-duel success, aerial-duel success | Read percentages alongside volume to avoid small-sample noise |
| Prevention | Progressive passes stopped, progressive carries stopped, shots blocked | Measures danger removed before it becomes a shot or chance |
| Tactical activity | Pressures by zone, pressure-to-turnover rate, team PPDA | Reflects team pressing scheme as much as individual output |
| Chance quality | Team xGA, individually attributed xG prevented, errors leading to shots | Lower conceded chance quality generally signals stronger defensive structure |
| Possession contribution | Passing accuracy under pressure, progressive passes, build-up involvement | Shows value added when the team has the ball, not just without it |
Later sections break down the formulas, benchmarks, attribution methods, and caveats behind each of these categories. For now, think of this table as the map. Everything else in this piece fills in the terrain.
How to Contextualize Defender Metrics
(((alt-img2)))
Here’s the thing about raw defensive numbers: they can lie to you without technically being wrong. A center-back who racks up nine clearances a game isn’t necessarily playing better than one who records three. Sometimes it just means their team spent 70 minutes without the ball, and he was the one left mopping up. Exposure bias is real, and it’s probably the single biggest trap in defender analysis.
Formation and role shift everything too. A full-back in a back five defends differently than one in a back four. A high defensive line creates more space in behind, which can inflate tackles and recoveries for center-backs who have to cover ground. A low block increases clearances and blocked shots simply because the opponent gets more shooting opportunities close to goal. Possession share, scoreline, venue, and opponent quality all nudge these numbers in ways that have nothing to do with individual quality. A center-back up 2 0 away from home in the final ten minutes faces a completely different job than one chasing a game at 0 1.
And then there’s the team outcome problem. Clean sheets and goals conceded get pinned on defenders constantly, but a goalkeeper’s shot stopping, a midfielder’s failure to track a runner, or just plain bad luck on an opponent’s finishing all factor in. Event data captures discrete actions like tackles and interceptions. Tracking data captures positioning, spacing, and recovery speed, things that never show up in a standard match log. Treating either as the whole story leaves gaps.
Before trusting any metric, run it through a quick checklist.
- Set a minutes threshold, using 900 minutes as a useful minimum and 1,500 minutes for stronger judgments.
- Show raw totals beside per 90 rates, success percentages, and attempt volumes.
- Adjust defensive action volume for opponent possession and territorial exposure.
- Group players by position, role, formation, line height, and tactical assignment.
- Control for opposition strength, venue, scoreline, match state, and schedule difficulty.
- Record provider definitions, pitch zones, event windows, and attribution rules.
- Validate event based outputs with tracking data and video where available.
- Flag uncertainty created by small samples, injuries, red cards, tactical substitutions, and low leverage minutes.
A percentage without its denominator is basically a rumor. Eighty percent tackle success sounds great until you learn it came from five attempts. Model based outputs like xG prevented should always come with some acknowledgment of uncertainty, whether that’s a confidence range or a plain language note about sample size.
This same framework, minutes threshold, possession adjustment, role grouping, opposition control, needs to be applied again before you move into role comparisons, advanced metrics, or anything resembling a scouting scorecard. Skip it at any stage and you just reintroduce the bias you worked to remove.
Tackles, Interceptions, Clearances, and Blocks as Defender Metrics
(((alt-img3)))
These four actions form the backbone of traditional defensive statistics, and for good reason. They’re visible, countable, and intuitive. But each one hides nuance that a glance at a stat sheet won’t reveal.
Tackles Won, Attempted, and Success Rate
Tackle success rate is calculated as tackles won divided by tackles attempted, multiplied by 100. A defender who wins 48 of 65 attempts posts a 73.8% success rate, which
Final Words
In the action, a defender’s work shows up as pressures, tackles, clearances, aerials, and the little stops that keep chances from forming.
This post laid out a balanced KPI scorecard, how to add context, event and tracking contrasts, prevention and xG measures, passing and role-specific KPIs, and a path to a scouting scorecard.
Use these statistical metrics to evaluate defenders in football matches to match numbers with video, avoid one-note judgments, and build clearer, more useful profiles — and you’ll make better calls moving forward.
FAQ
Q: What is a balanced defender KPI scorecard?
A: A balanced defender KPI scorecard is a multi-dimensional set of measures that combines volume, efficiency, prevention, tactical, chance-quality, and possession indicators to evaluate defenders beyond tackles or clean sheets alone.
Q: Which KPI categories should I include to evaluate defenders?
A: The KPI categories to include are defensive volume, efficiency, prevention, tactical activity, chance-quality, and possession contribution—each capturing different defensive responsibilities and game phases.
Q: How should I contextualize defender metrics?
A: Contextualizing defender metrics means adjusting for minutes, position, team possession, formation, opponent strength, match state, and data provider definitions to avoid misleading rankings from raw counts.
Q: What minimum minutes make defender stats reliable?
A: Use 900 minutes as a useful minimum and 1,500 minutes for stronger judgments, since small samples under 900 minutes produce noisy percentage and rate estimates.
Q: How do tackles, interceptions, clearances, and blocks inform evaluation?
A: Those event metrics show where and how often a defender intervenes; pair per-90 rates with location, attempt volumes, and success rates to separate volume from quality and read anticipation from mere exposure.
Q: How should duel and aerial metrics be used?
A: Duel and aerial metrics measure contest success and timing; always report volume plus success percentage, noting aerials in the box and one-on-one wins carry greater defensive value than low-risk duels.
Q: What do pressures and PPDA tell us about pressing and prevention?
A: Pressures and PPDA measure pressing intensity and how often pressure forces turnovers; PPDA (opponent passes ÷ defensive actions) is a team/unit metric and lower values indicate higher pressing aggression.
Q: How do xG and possession-adjusted metrics apply to defenders?
A: xG and possession-adjusted metrics show chance quality conceded and individual danger stopped; individual xG prevented sums xG of stopped events, while possession-adjusted actions scale defensive work by opponent possession share.
Q: Which passing and build-up metrics matter for modern defenders?
A: Key on-ball metrics include pressured pass completion, progressive passes per 90, passes into the final third, long-pass accuracy, progressive carries, and involvement in progressive build-up sequences.
Q: How do I compare defenders by role using tracking data?
A: Compare defenders by role using role-specific KPIs—centre-backs for aerials and clearances, full-backs for pressures and recovery runs—and add tracking KPIs like line height, positioning heatmaps, and recovery speed.
Q: How do I build a scouting scorecard from defender metrics?
A: Build a scouting scorecard by selecting a role template, importing 8–12 contextualized metrics, converting to percentiles, visualizing with charts and maps, adding film grading, and validating any composite index weights.
Q: When do defender evaluations need specialist data or deeper analysis?
A: Specialist data or further analysis is needed for high-risk recruitment, spacing and partnership questions, individual xG/xA attribution, cross-league comparisons, or sudden performance shifts that event data alone can’t explain.
More from Politics
 Events
Most Memorable Underdog Upsets in Olympic History
 Analysis
Set-Piece Mastery: Decoding Corners and Free-Kicks Tactically
 Analysis
Statistical Metrics That Truly Define Midfield Mastery
 Analysis